Consumer adoption of digital health in 2022: Moving at the speed of trust
Thank you to the Stanford Center of Digital Health for their continued collaboration on this work, with special gratitude to Natasha Din, MD, Cassandra Broadwin, MPH, and Nina Molanphy.
With COVID-19 entering endemic territory and a pandemic-fueled funding cycle closing, digital health is completing its transition from emerging concept to routine component of healthcare delivery. In our 2022 Digital Health Consumer Adoption Survey (hereto referred to as the “Survey”), eight out of every ten survey respondents reported having accessed care via telemedicine at some point in their lives—suggesting that, for most Americans engaging in the healthcare system, the new-car mystique of virtual experiences may soon feel like ol’ reliable.
As digital health hits social maturity, the sector will no longer be able to rely on the public health emergency (twelve times renewed, now set to end May 11, 2023) to boost growth. Instead, continued momentum will require creating more accessible, affordable, and trustworthy offerings for providers and consumers. In this review of Rock Health’s 2022 Survey responses, we dive into the top consumer insights and how they might catalyze—or cramp—digital health progress in the years ahead:
- Telemedicine reached the 80% adoption mark overall, becoming the preferred channel for prescription care and minor illness
- Audio-only and asynchronous telemedicine beat out point-to-point video chats as the most-used telemedicine modalities, with live phone, apps, and messaging resurging
- While adoption of wearable devices rose, clinical use of wearables hasn’t caught up to D2C
- Health data sharing only moves at the speed of trust, and right now it’s slow going
Note on methodology: Since 2015, Rock Health has annually surveyed a U.S. Census-matched sample of adults to check the pulse on consumers’ attitudes toward and behaviors surrounding digital health.1 Respondents used their personal desktop, laptop, smartphone, or tablet to complete the survey in English. Over the last three years (2020-2022), approximately 8,000 U.S. adults were surveyed each year, with 2022’s cohort totaling 8,014 respondents. The Survey was administered from July 12 to August 22, 2022.
Telemedicine reached the 80% adoption mark overall, becoming the preferred channel for prescription care and minor illness
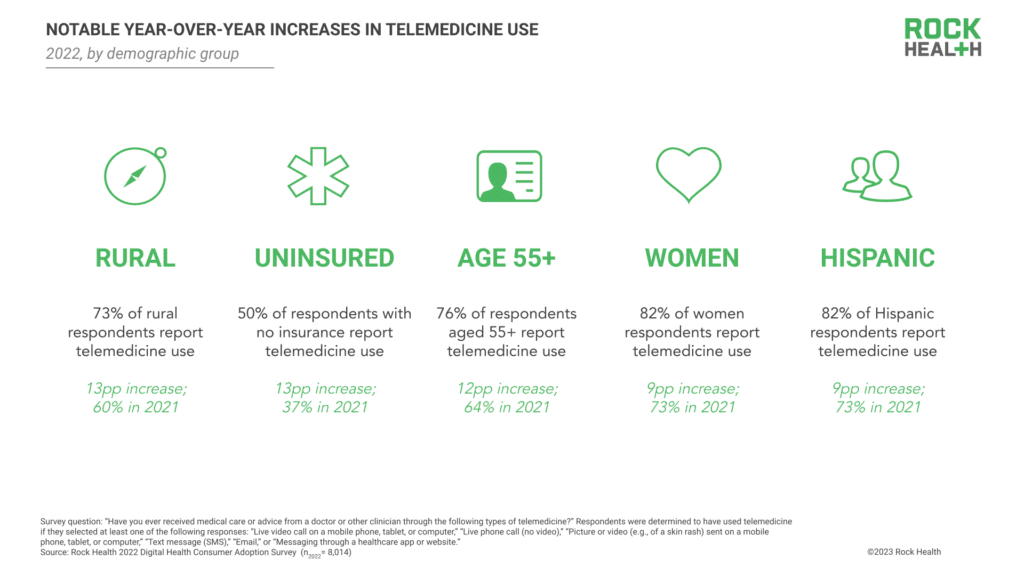
In our 2022 Survey, 80% of all respondents reported having accessed care via telemedicine at some point in their lives, up 8pp from 72% in 2021. While telemedicine use continues to vary across demographic segments, 2022 saw notable adoption increases among groups that have long been underserved within healthcare. The greatest year-over-year increases were observed among respondents aged 55+ (12pp increase; 76%, up from 64%), respondents living in rural areas (13pp increase; 73%, up from 60%), and respondents without health insurance at the time of our survey (13pp increase; 50%, up from 37%).2 Telemedicine use also increased among women, with 82% of women respondents reporting having used telemedicine (9pp increase from 2021). Eighty-two percent of Hispanic respondents reported telemedicine use, reflecting a 9pp increase since 2021—the greatest percentage point increase among all racial and ethnic groups captured by the Survey.3
Consistent with 2021 survey results, LGBQA+, transgender, and non-binary respondents reported higher rates of telemedicine use when compared to heterosexual and cisgender respondents.4 Telemedicine use increased slightly year-over-year among transgender respondents, with 98% reporting having used telemedicine (2pp increase from 2021)—suggesting that nearly all transgender respondents have used telemedicine at some point in their healthcare journeys.

Consumers’ increase in telemedicine adoption is likely bolstered by both supply-side and demand-side dynamics. On the supply side, provider organizations—already stretched thin by clinician shortages—see telemedicine visits as a means to improve appointment efficiency, elevate professional satisfaction, and expand patient reach. Meanwhile, startups like Ro, Hims&Hers, and Thirty Madison continue to utilize telehealth as a means to supply on-demand care to consumers who are looking for cash-pay options.
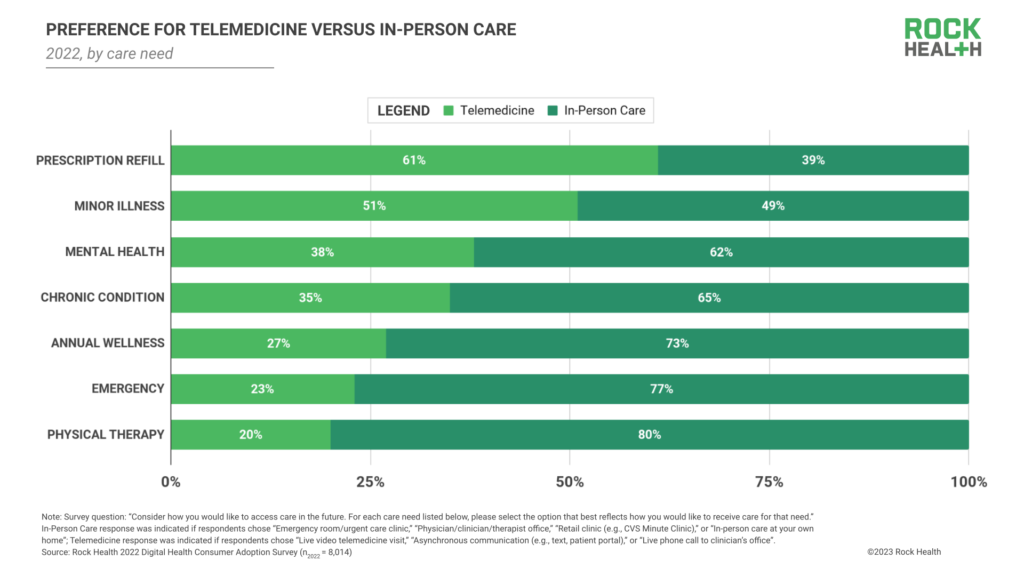
On the demand side, convenience plays a factor. For the first time, telemedicine surpassed in-person visits as consumers’ preferred channel for prescription refills (61% of respondents reported preferring telemedicine) and minor illness care (51% of respondents reported preferring telemedicine). Telemedicine’s convenience value for refills is even more pronounced for individuals managing many prescriptions; 71% of respondents with 4+ current prescriptions at the time of the survey reported preferring telemedicine to in-person care for prescription refills, compared to 64% of respondents with 1-3 current prescriptions. Given this data, we’re interested to see if virtual-first flat rate prescription refill programs like Amazon’s recently-launched $5 a month RxPass prove to be attractive (and disruptive) consumer offerings, especially for consumers managing multiple prescriptions. Consumers will likely also continue to seek out telemedicine visits for individualized care needs, which may be more difficult to access in-person given regional constraints; offerings like telemedicine-based eating disorder support (Equip), gender-affirming hormone care (Plume), medication abortion care (HeyJane), and Latino-focused care (Zócalo Health) all secured funding last year.5
Who are today’s telemedicine holdouts? Of the 20% of respondents who reported no prior telemedicine use, 44% indicated that they prefer to discuss health in person. While we expect that certain respondents will continue to prefer—and seek out—in-person care instead of telemedicine, telemedicine’s network effects could change the tide for these individuals.
We’re excited to see telemedicine become the preferred modality for lower-acuity health engagements like minor illness visits and prescription refills. However, it’s critical that digital health innovators balance virtual convenience with a sustained commitment to high-quality, responsible care delivery. As digital health recovers from scrutiny around low-quality telehealth experiences and virtual over-prescribing of controlled substances, sector players will need to be especially mindful of best practices when capitalizing on telehealth’s momentum.
Audio-only and asynchronous telemedicine beat out legacy point-to-point video chats as the most used telemedicine modalities, with live phone, apps, and messaging resurging
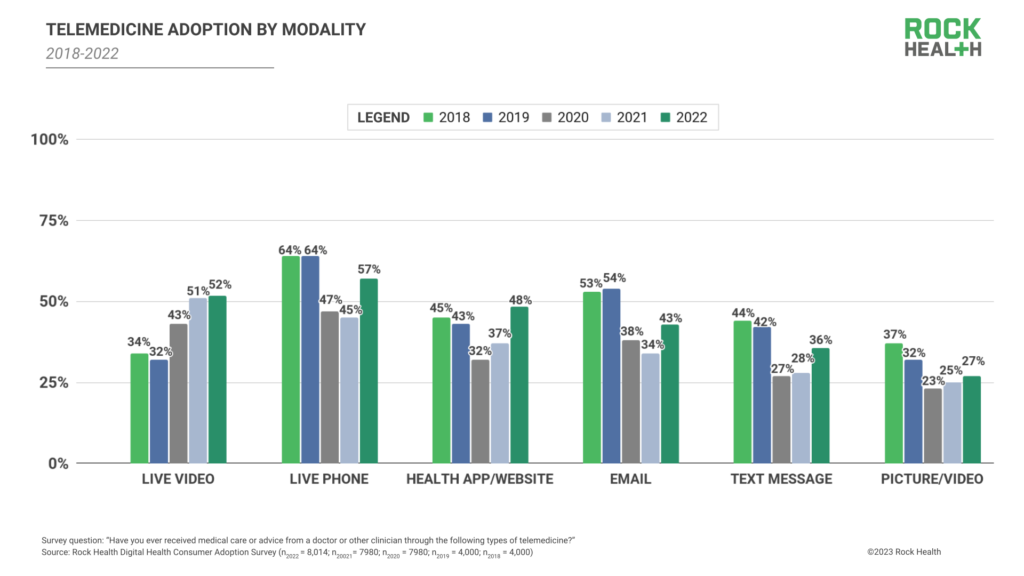
While live video telemedicine use remained stable in 2022 (1pp increase relative to 2021), we noted increases across all other telemedicine modalities: live phone (57%; 12pp increase), health app/website (48%; 11pp increase), email (43%; 9pp increase), text message (36%; 8pp increase).
Multiple factors contribute to non-video telemedicine use, including the continued lag in national broadband coverage.6 Another likely contributor is the growing supply of non-video appointment offerings, bolstered by provider organizations. As we’ve shared in prior consumer adoption reports, COVID-19 emergency declarations introduced billing and regulatory exceptions, encouraging provider organizations to offer telemedicine appointments across all modalities. These exceptions continue to motivate provider use of non-video telemedicine channels, especially after HIPAA compliance requirements for video platforms were reinstated. At present day, audio-only telemedicine visits bring in similar, if not identical, reimbursement dollars but increase access to patients, require less enterprise overhead (e.g., reduced IT investment in maintaining or upgrading live-video software), and allow clinical staff more flexibility for when and how they engage with patients—all factors that encourage provider organizations to continue offering telemedicine “beyond the screen.”
Even with the COVID-19 Public Health Emergency (PHE) currently set to end May 11, 2023, certain protections for non-video telemedicine have been extended or made permanent. For example, Centers for Medicare and Medicaid Services (CMS) will issue permanent coverage of behavioral/mental telehealth services delivered using audio-only communication platforms and will extend coverage of some non-behavioral/mental telehealth services delivered using audio-only communication through December 31, 2024. Where CMS leads, payer organizations typically follow, meaning non-video telemedicine channels are likely to find permanent or longstanding reimbursement pathways—further encouraging provider usage of non-video telemedicine.
In direct-to-consumer (D2C) care contexts, where digital health startups are most often billing customers directly for care, there are operational benefits to engaging with patients via non-video telemedicine offerings. For example, direct primary and urgent care startups including K Health and Lemonaid Health have long used online chat and in-app assessments as part of virtual care delivery to enhance consumer engagement and support load balance for clinicians. Increasingly, AI tools are being explored as integrations into D2C telemedicine visits, helping to collect upfront information during visits and support clinicians’ medical decisioning.
In both traditional and D2C healthcare contexts, we expect typical care journeys will include several different telemedicine modalities, complementing in-person care. Live video consults will likely be used for discrete consultations, while live phone and messaging tools will be utilized for appointment follow-ups and prescription refills (particularly if billing possibilities are expanded for telemedicine modalities like messaging). Healthcare organizations structuring these multi-modal flows have the critical challenge of ensuring that telemedicine offerings ensure continuity of care, integrate in ways that are convenient for both providers and patients, and incentivize providers to improve overall quality of care—rather than optimizing total billing per patient.
While adoption of wearable devices rose, clinical use of wearables hasn’t caught up to D2C
In 2022, 46% of Survey respondents reported owning a wearable device, a steady albeit small increase from 2021 (45%) and 2020 (43%).7 However, as overall wearable ownership grows toward the 50% threshold, ownership disparities remain among consumer communities.
First, wearable ownership remains more prevalent among respondents with “early adopter” characteristics: 74% of younger respondents with higher income and higher educational attainment reported owning a wearable. However, wearable ownership among this cohort declined from its peak in 2020 (80%)—this aligns with 2022 buying trends, with global consumer wearable sales slacking amid inflation and recessionary concerns.
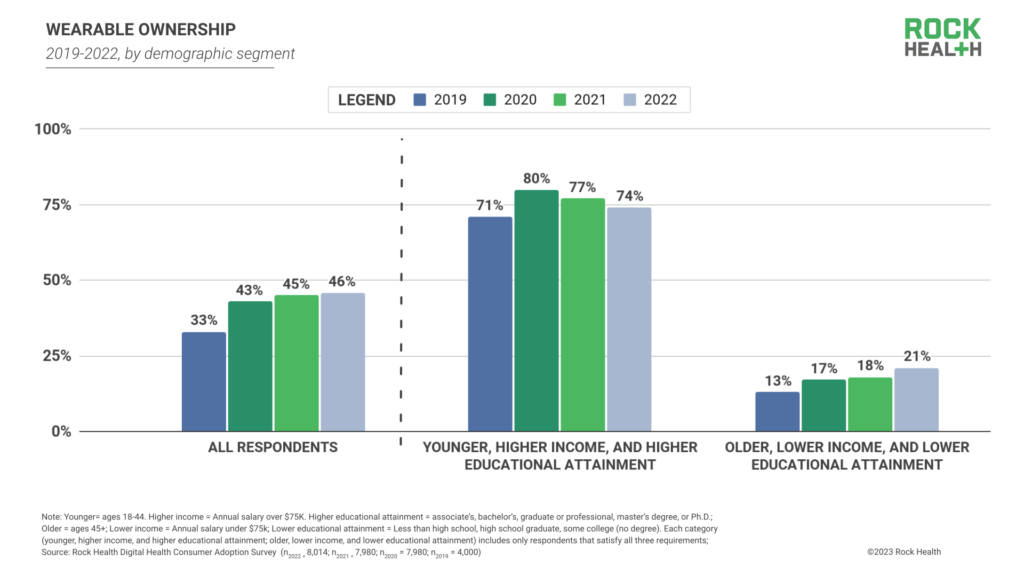
Conversely, wearable ownership among older, lower income, and lower-educational attainment respondents reached an all-time high in 2022 (21%), a 3pp increase from 2021 (18%) and a consistent upward trajectory from 2019 (13%). This increase, paired with early adopters’ decrease in wearable ownership, suggests that wearable technology is continuing its shift along the technology adoption curve—from early adoption to majority acceptance. This movement also may reflect work by brands like Best Buy and Samsung to increase wearable adoption among seniors.
Controlling for other demographic variables, respondents who rated their health as “excellent” had significantly greater odds of wearable ownership compared to those who rated their health as “very poor.”8,9 Further illustrating the extent of this difference, 62% of survey respondents who rated their health as “excellent” reported owning a wearable, compared to only 23% of those who rated their health as “very poor.”
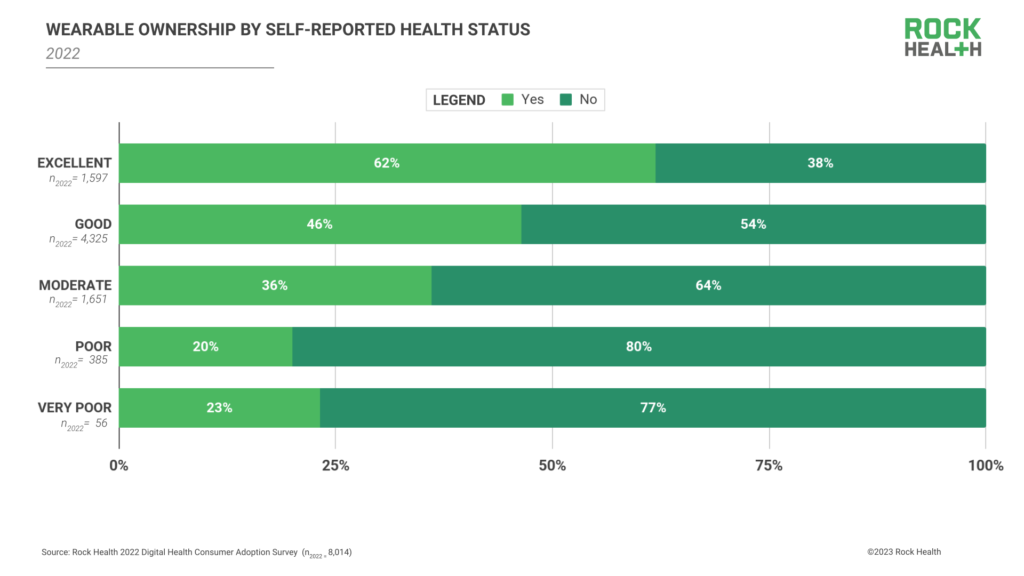
Disparities in wearable ownership by health status corroborate industry-leading research from organizations like the American Health Association, which suggests that wearable use still skews toward the “worried well” or consumers who are in good health but pay heightened attention to their health status. One contributor to higher wearable ownership among the “worried well” is that the majority of consumers are still purchasing their wearables directly (D2C), rather than receiving them via a healthcare program or regimen. Eighty-five percent of survey respondents reported their wearable was either purchased by them or gifted to them, while only 13% reported they received their wearable in a healthcare or employment setting (from a clinician, health insurer, employer, or clinical trial/research study).10
While the D2C wearables market remains steady, there’s more to be done to connect individuals to wearables that improve disease management or monitor disease progression. Providers, employers, payers, and clinical trial sponsors will be key partners for getting wearables into (or, better yet, onto) the hands of individuals who could use them to manage medical conditions. In late 2022 and early 2023, wearable device makers took measured steps to build relationships with providers, payers, and trial sponsors to prove out their value in clinical applications. WHOOP identified a pregnancy digital biomarker for premature birth screening, Oura announced a digital birth control partnership with Natural Cycles, and Apple picked up FDA clearance for Parkinson’s symptom monitoring. But in order to really catalyze wearables’ clinical integration, remaining barriers such as limited reimbursement pathways, EHR integration challenges, and providers’ data overwhelm will need to be meaningfully addressed.
Health data sharing only moves at the speed of trust, and right now it’s slow-going
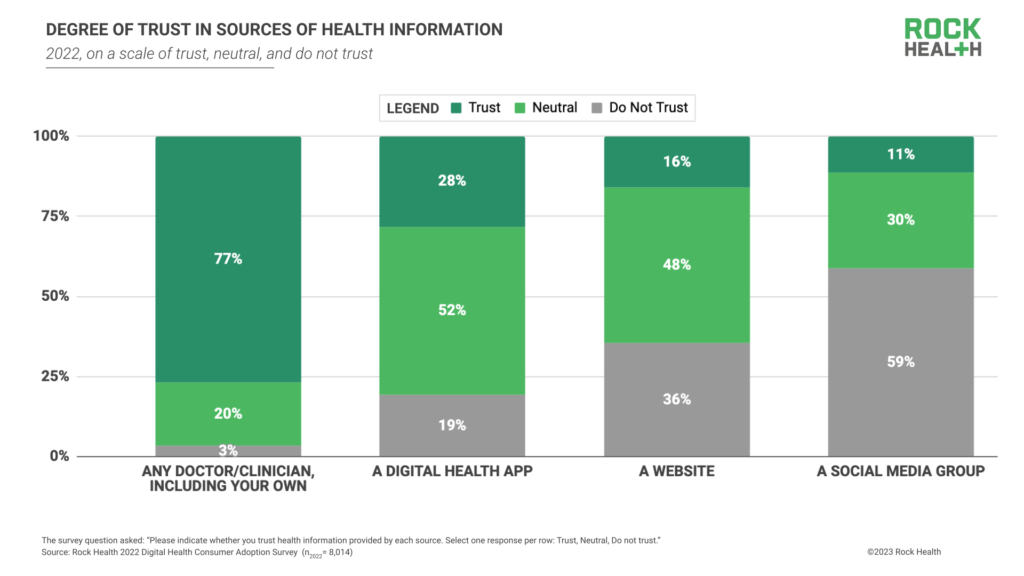
In a post-2020 environment marked by consumers’ wavering trust in the healthcare system, it’s notable that our Survey data corroborates industry research indicating that providers remain consumers’ most trusted messengers of health information. In 2022, respondents reported much higher rates of trust in doctors/clinicians (77%) compared to other sources outside of the formal healthcare system, including digital health apps (28%), websites (16%), and social media groups (11%). It’s worth noting that amidst the online proliferation of health misinformation, these lower rates of trust may suggest that consumers are simply becoming more judicious in sourcing health materials.
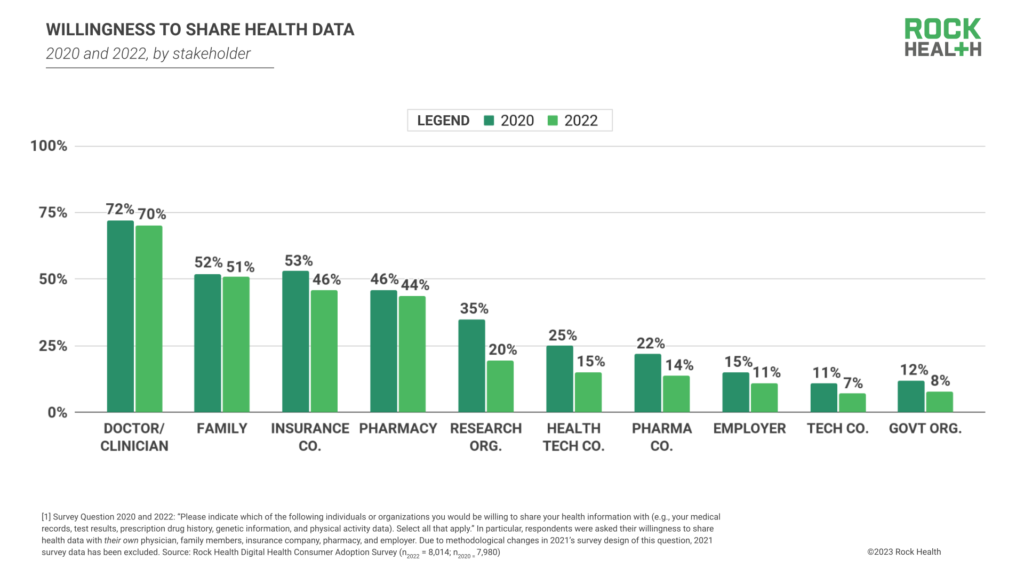
Beyond shaping care-seeking decisions, consumers’ level of trust in healthcare entities also informs their willingness to share their healthcare data across the care delivery and research chain. In 2022, 70% of respondents reported willingness to share their health data with their doctor/clinician. To a lesser extent, respondents were also willing to share their health data with family (51%), insurance companies (46%), and pharmacies (44%). This dynamic suggests that consumers are most motivated to share data when that exchange stands to directly improve their quality of care.
Consumers have grown less willing to share health data with larger academic, employer, commercial, and regulatory entities since 2020, including research organizations (20%, 15pp decrease), health technology companies (15%, 10pp decrease), pharmaceutical companies (14%, 8pp decrease), their employers (11%, 4pp decrease), technology companies (7%, 4pp decrease), and government organizations (8%, 4pp decrease).11 These decreases likely stem from growing public attention toward healthcare data privacy and responsible data usage. With recent headlines uncovering commercial and government exploitation of consumer health data as well as hundreds of health data breaches, it’s understandable that consumers are more reluctant to share personal information to organizations whose incentives may conflict with or expand beyond their personal interests.
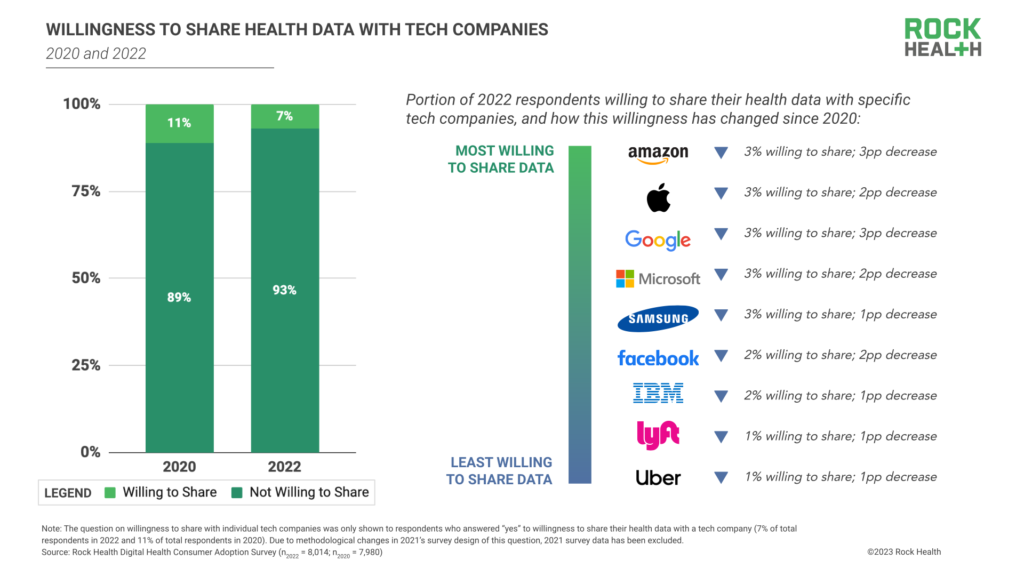
A small portion of respondents (7%) are willing to share their health data with technology companies—accordingly, respondents’ willingness to share with individual tech companies also declined from 2020 to 2022.11
What needs to be done to build back consumer trust? As we’ve written recently, Big Tech and healthcare investments in cybersecurity infrastructure and patient data management are necessary steps to improve security and privacy (and consumers’ perception thereof), and motivate consumers’ willingness to share health data. For clinical and academic researchers interested in using aggregate patient data to inform medical research and development or public health surveillance, trust-building measures such as transparent data-sharing protocols and data accountability reporting are needed to restore public confidence and participation. In the coming years, we’ll be watching to see which data protection and privacy measures become the norm as healthcare organizations work to build relationship capital. Chances are good consumers will be keeping a close eye too.
Maintaining momentum
2022’s Survey data suggests consumers are increasingly turning to telemedicine for low-acuity care, revisiting non-visual modalities, gradually growing their rates of wearable ownership, and rethinking their health data sharing with healthcare and non-healthcare entities. But with the wheels of telemedicine no longer greased by extraordinary funding and exceptional regulatory circumstances, digital health still needs more support to reach its summit. We hope this comes in the form of a continued commitment to high-quality care, strengthened telehealth and patient monitoring reimbursement pathways, and (re)fueled consumer trust. In 2023, the digital health innovators that advance products and programs that optimize outcomes, reduce costs, and improve patient experiences will buttress adoption for years to come.
Ready to dive into eight years of consumer insights?
Reach out to Rock Health Advisory to dig even deeper into our longitudinal Digital Health Consumer Adoption Survey dataset. With guidance from our team, explore questions like:
- What are the top drivers of consumers’ wearable use, and how have these drivers changed since 2021?
- How are digital tracking patterns evolving among respondents living with diabetes (or other chronic illnesses)?
- How does telemedicine adoption compare between Medicaid enrollees and the commercially-insured?
- Which age groups are most willing to share their health data with providers? Technology companies?
Tap into insights and strategic guidance for enterprise companies with Rock Health Advisory.
Get in touch with the venture team at Rock Health Capital.
Join us in building a more equitable future at RockHealth.org.
And last but not least, stay plugged into the Rock Health community and all things digital health with the Rock Weekly.
Footnotes
- Respondents are census-matched by gender, age, U.S. region (Northeast, Midwest, South, West), race/ethnicity, and annual household income.
- Telemedicine use was analyzed by respondents’ self-reported gender, sexual orientation, transgender identity, race/ethnicity, area description, annual household income, and insurance status.
- Race and ethnicity response options included: American Indian or Alaska Native; Asian; Black or African-American; Hawaiian Native or Pacific Islander; Hispanic or Latino/a/x; White; Other; Prefer not to disclose. Respondents could select multiple responses.
- “LGBQA+” includes respondents who self-identify as lesbian, gay, queer, and other non-heterosexual identities. In the Survey, we asked a question about transgender identity separate from questions about sexual orientation and gender identity.
- Equip is a Rock Health portfolio company.
- Rural respondents continue to bear the brunt of internet inequity; in 2022, respondents living in rural areas reported using live phone telemedicine (51%) at greater rates than they used any other telemedicine modality.
- Consumers were asked whether they owned a “wearable device or smartwatch.”
- Other demographic variables that were controlled for were respondent age, gender, income, education, race/ethnicity, and insurance status.
- (OR:2.14; CI:1.11-4.13; p<0.05)
- Two percent of respondents answered “None of these”.
- Due to methodological changes in 2021’s survey design of this question, 2021 survey data has been excluded.